
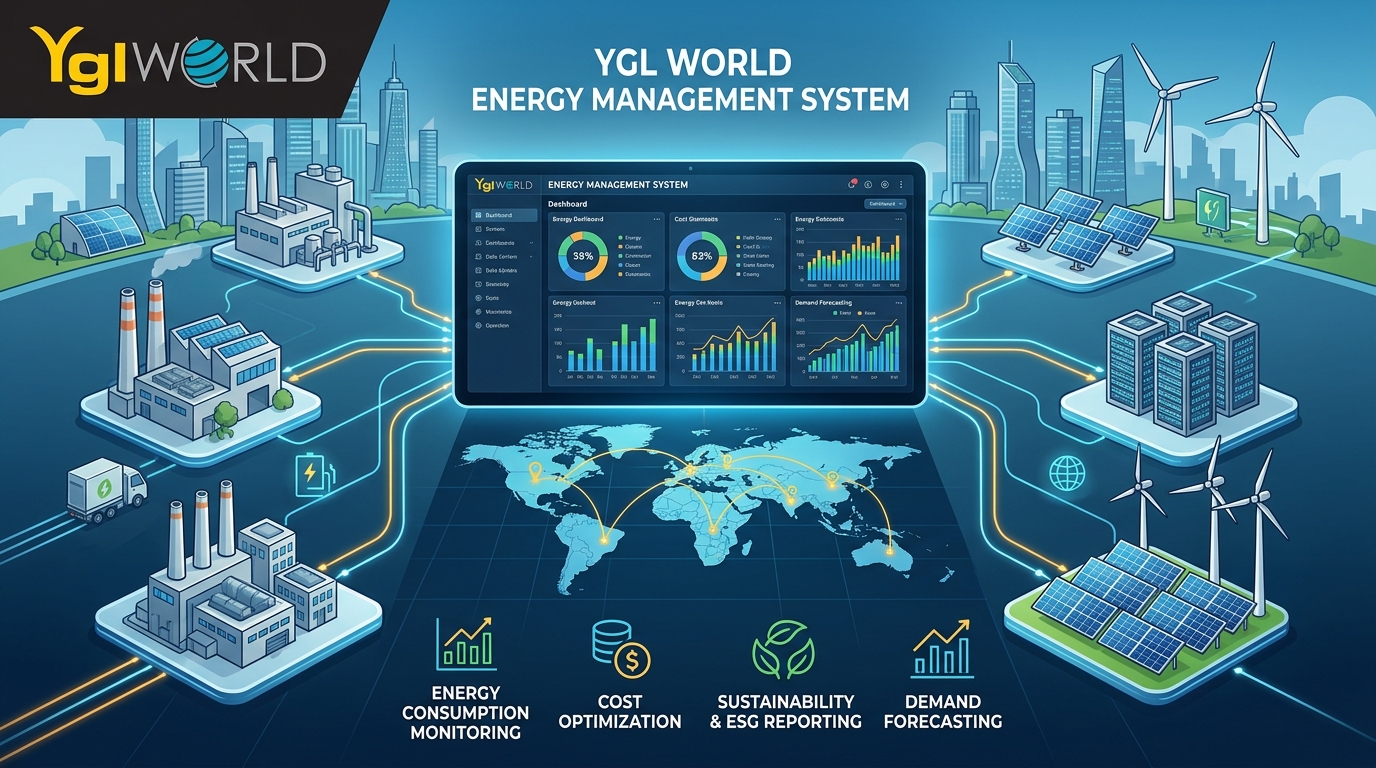
An energy management system turns scattered electricity, water, and fuel data into decisions that cut cost and carbon. For Malaysian manufacturers, that shift matters more than ever. Tariffs keep climbing, buyers ask harder questions about emissions, and regulators expect verified numbers rather than estimates. Yet most factories still track consumption through monthly bills and spreadsheets. YGL closes that gap with an AI-powered energy monitoring platform that connects your utility data, your production systems, and your sustainability reporting in one place.
What Is an Energy Management System in Manufacturing?
Think of it as the control tower for every joule your plant consumes. The platform ingests utility inputs, links them to production output, and then explains why consumption moved. Instead of a flat number at month end, you see cost per machine, per shift, and per tonne produced.
From Utility Bills to Real-Time Visibility
Traditional tracking is reactive. Bills arrive weeks late, so waste is discovered long after it happened. Modern energy management software reverses that sequence. Consumption is normalised into a common cost model, benchmarked against historical baselines, and flagged the moment a pattern breaks. Because the system learns your load profile, it distinguishes a genuine anomaly from a busy production day.
Why Malaysian Manufacturers Need Energy Management Now
Three pressures converge on the factory floor, and each one has a financial edge.
Rising Utility Costs and Thin Margins
Electricity often ranks among the top three controllable costs in machining, moulding, and plywood processing. However, few plants know which asset drives peak demand. A compressor leak, an idling chiller, or a poorly scheduled furnace can quietly erode margin for months. Real-time metering and cross-utility analytics typically reduce energy waste by 10 to 30 percent, which flows straight to the bottom line.
ESG Reporting and Carbon Disclosure Pressure
Bursa-listed companies and export suppliers must now disclose Scope 1 and Scope 2 emissions with audit-ready evidence. Manual carbon accounting is slow and error-prone. Consequently, many teams spend weeks rebuilding numbers at year end. With an integrated emissions engine, every kilowatt-hour maps automatically to CO₂e using approved emission factors. Reporting becomes a by-product of daily operations rather than an annual scramble.
Fragmented Legacy Systems
ERP, MES, SCADA, and facilities platforms rarely speak to one another. As a result, operational context sits in one silo while utility cost sits in another. Nobody can answer the simple question: what did this batch actually cost in energy?
How the YGL Energy Management System Works
Our approach follows a practical three-stage flow, proven in live manufacturing deployments.
Stage 1: Capture and Consolidate Utility Data
First, the portal ingests electricity, water, and fuel streams, whether they come from smart meters, SCADA tags, or scanned bills. Operational data from ERP and MES joins them inside a centralised data lake. Because we start with the bills you already have, value appears before a single new sensor is installed.
Stage 2: Analyse with AI and Digital Twin
Next, machine learning models forecast consumption, detect anomalies, and attribute variance to a specific asset or process. Alongside them, a Digital Twin mirrors the behaviour of your energy-consuming equipment. Teams can therefore simulate load shifting, fuel switching, or schedule changes, and see the cost and carbon impact before committing physically.
Stage 3: Act on Prioritised Recommendations
Finally, an agentic AI layer converts analysis into action. It identifies where cost and emissions concentrate, pinpoints the root cause, then suggests a corrective step with explicit trade-offs. Rather than another dashboard to interpret, your engineers receive a ranked worklist.
Core Features of AI-Driven Energy Management Software
- Cross-utility dashboards covering electricity, water, gas, and diesel in one view
- Anomaly alerts delivered by email or mobile within minutes of detection
- Energy intensity metrics such as kWh per unit, per line, and per shift
- Automated Scope 1 and Scope 2 calculation aligned to recognised reporting frameworks
- Digital Twin scenario modelling for decarbonisation planning
- Open integration with ERP, MES, WMS, SCADA, and building management systems
- Audit trails that keep evidence traceable for assurance and verification
Measurable Benefits of Energy Monitoring
Good data changes behaviour quickly. Plants that adopt structured energy monitoring commonly report lower peak demand charges, fewer unplanned stoppages, and tighter maintenance scheduling. Moreover, procurement teams gain leverage during tariff negotiations because consumption patterns are documented. Sustainability officers benefit too, since verified figures strengthen customer audits, green financing applications, and grant submissions.
Return on investment usually arrives through four channels:
- Reduced consumption from eliminating identified waste
- Avoided demand penalties through smarter load scheduling
- Lower reporting effort as manual data collection disappears
- Extended asset life when inefficiency reveals developing faults
Bills Before Sensors: A Practical Deployment Path
Many vendors insist on full instrumentation upfront. That approach is expensive and slow. We prefer a staged path. Phase one uses existing billing and production records to build the baseline. Phase two adds metering only where analysis shows real opportunity. Ultimately, you invest in hardware with evidence rather than assumption, and the payback story stays clear to your board.
Built for Green Productivity, Not Just Compliance
Compliance is the floor, not the ceiling. The same energy data that satisfies an auditor also drives productivity. When engineers see energy per unit alongside yield and downtime, improvement projects become easier to justify. In short, energy management becomes an operational discipline instead of a reporting chore.
Start Your Energy Management Journey with YGL
YGL Intelligent Technology has delivered ERP, MES, WMS, and ESG solutions to manufacturers across Malaysia, Singapore, and Hong Kong for more than two decades. Our Green Manufacturing Intelligent Portal brings that experience together in a single platform for energy management, carbon accounting, and green productivity.
Ready to see where your energy budget really goes? Talk to our team about a baseline assessment using the data you already hold.
We look forward to hearing from you. Contact us today so that we can help you with our YGL NERVO which is strategy Industry 4.0 ready implementation needs heading towards Industry 4.0 in smart warehouse and smart manufacturing.
YglWorld PG (HQ)
35, SCOTLAND ROAD
10450 Penang Island
YglWorld KL
Suite 9-10
Wisma UOA II,
Jalan Pinang 50450
Kuala Lumpur